Monitoring Search service in SharePoint:

Alright are you one of those guys who manages the SharePoint infrastructure in your firm all alone? Do you think you’re really doing a good job in monitoring all the mission critical services such as Search, User profile services, Managed metadata, BI & BCS? Well if you’re already doing that then kudos to you but if you’re not then you definitely know how messier things could get if they break and you didn’t notice that .

So with that being said I’m going to discuss about monitoring Search service in this post. You see, the problem with search is, it always needs some extra caring and boosting when compared to other SharePoint services. If you just deploy search service and then test it and say “Alright…I’m done deploying search …It works fine, my users can get what they want and I’m a happy person now”…. then you’re making a very bad mistake .If there is any other application you treat this way then I just can’t think about how bad the aftermath would be.

Well ,I don’t mean to scare you guys ,but being SharePoint practitioners  don’t you guys think Search needs a little more extra caring ? I would say yes it does and the purpose of this post is to let you know about the inbuilt tools that SharePoint search service offers to diagnose/monitor it and how you guys can start doing that if you’re not doing that already.

As you all know, Search is really  mission critical for any successful SharePoint based intranet portal and it’s the job of the SharePoint engineer (you)  to perform the below mentioned steps  to check and ensure that the search service is running fine without any issue.

Note: It probably won’t be a good idea to do all these steps on daily basis unless you really want to spend couple of hours every day just in monitoring search .However, it would still make sense to perform step 2,7 & 14  everyday just to make sure that search is running fine . You can perform all the other steps on a weekly basis.

Alright now let’s get into the real meats and potatoes…..

1.Access the Search service application from the Central administration using the Farm admin account .(If you’re not given Farm admin rights, make sure you’re atleast given Search service application administration rights )

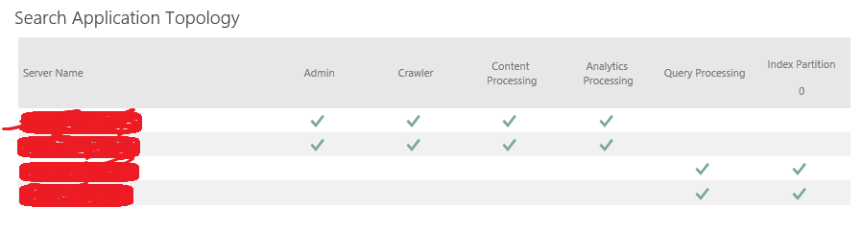
2. Once you’re in the “Search Administration “ page take a look at the Search Application topology section and make sure all the search components shows up green . Take a look at the screenshot below.

1

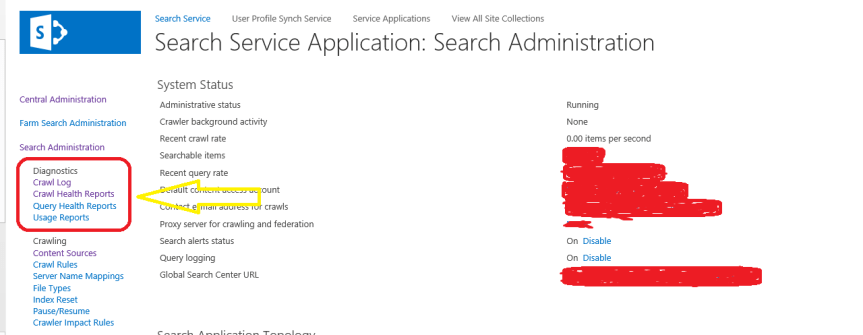
3. Once you confirmed that everything shows up green, now it’s time to take a look at the Crawl For this navigate to the “Diagnostics section in the Search administration page as shown in the screenshot below and take a look at the “Crawl Logs “ .

2

4. The search crawl logs can help you identify the below mentioned three things ….

a) Whether crawled content was successfully added to the index

b) Whether it was excluded because of a crawl rule

c) Whether indexing failed because of an error.

 5. Make sure you take a look at everything and ensure that the results are fine.

6. Also you get different views such as (Content Source, Host Name, Crawl History, Error Breakdown, Databases, URL View) for the Crawl logs in the diagnostics section. Take a look at all these sections and ensure that the results are fine .Check for Errors and see if the count is high, if yes take a look at what’s triggering the errors. I made a different post on working with Search crawl logs before, please click here to access it.

7. Once you’re done with that, take a look at the “Crawl Health reports “and check each and every section there. You get the reports on all the below mentioned areas.

  • Crawl Latency
  • Crawl Queue
  • Crawl Freshness
  • Content Processing Activity
  • CPU and Memory Load
  • Continuous Crawl

3

8. You also get to apply filters so that you can get a customized view.

9. Now let’s take a look at what information each and every criteria has under the Crawl health reports.
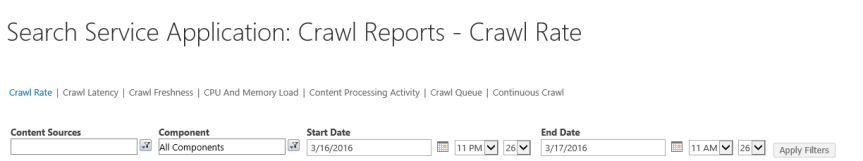
A) Crawl Rate

For a specified time interval, shows a graph and a summary of the following:

  • Number of content items crawled per minute. This includes:
  • Total content items
  • Modified items. These are content items that were changed and re-crawled.
  • Not modified items. These are content items that were not changed and were not crawled.
  • Security items. These are content items for which the security attributes were changed.
  • Deleted items. These are content items that were deleted from the content source and which must also be deleted from the index.
  • Average number of other crawl actions that were performed per minute. This includes:
  • Retries (crawl retries)
  • Errors (crawl errors)

You can filter this report by:

  • Start date/time
  • End date/time
  • Content sources (for example, Local SharePoint sites)
  • Machine

B)Crawl Latency:

For a specified time, shows a graph of the number of items that form the crawl load, for each of the following:

  • In Crawler Queue
  • Waiting to submit to content processing
  • Submitted to content processing
  • Waiting to Commit (SQL)

You can filter this report by machine only.

For a specified time interval, also shows a graph and a summary of the crawl latency; the amount of time in milliseconds that each content item is in each of the following subsystems in the feeding pipeline:

  • Crawler
  • Protocol handler (PH)
  • Repository
  • SQL Time

You can filter this report by:

  • Start date/time
  • End date/time
  • Content source (for example, Local SharePoint sites)
  • Machine

10. Pay close attention to the “Latency “and “CPU and Memory Load” section and make sure the graph looks fine without any abnormal spikes. You also have an option to apply filters, if necessary apply filters and take a look at all the search components.

11. Finally navigate to the crawling section as shown in the figure below and take a look at the content sources.

C) Crawl Queue:

For a specified time interval, shows the number of items in the following two crawl queues:

  • Links to process. This is the number of uncrawled URLs that are queued to be crawled.
  • Transactions queued. This is the number of crawled URLs that are queued to be processed in the crawl pipeline.

You can filter this report by start date/time and end date/time.

D) Crawl Freshness:

For a specified time interval, shows the freshness of the content that was being indexed by the search system. The last modified time stamp of each document is compared with the time specified in the graph. You can view the freshness of the content as follows:

  • Less than 1 month ago
  • Less than 1 week ago
  • Less than 1 day ago
  • Less than 4 hours ago

E) Content Processing Activity:

For a specified time interval, shows the amount of time that was spent in content processing for:

  • Content sources
  • Machines
  • Content processing components
  • Content processing activity

The graph shows the amount of time that was spent in various content processing activities, such as:

  • Linguistics processing
  • Document parsing
  • Document summary generation
  • Indexing

You can filter this report by:

  • Start date/time
  • End date/time
  • Content source
  • Machine
  • Content processing component name
  • Processing activity

F) CPU and Memory Load:

For a specified time interval, shows the percentage of CPU used, the memory use in megabytes and the system overview for these processes:

  • MSSDmn
  • MSSearch
  • NodeRunner
  • Timer

You can filter this report by:

  • Machine
  • Start date/time
  • End date/time

G) Continuous Crawl:

For a specified time interval, shows the time (in milliseconds) that the processes took with an overlay of discovery time (in minutes) for:

  • Time In Links Table
  • Time In Queue Table
  • Crawler Time
  • PH (Protocol Handler) Time
  • Repository Time
  • Content Pipeline Time
  • SQL Time

You can filter this report by:

  • Content sources
  • Start date/time
  • End date/time
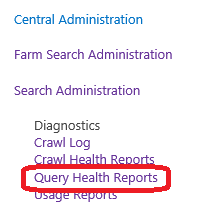
  1. Once you’re done checking the “Crawl Health Reports” now it’s time to take a look at the “Query Health reports “.For this click on the “Query Health Reports “link under Diagnostics section as shown in the image below.

4

11. Here you will get reports based on the below mentioned criteria’s and you can filter them as well as per your need.

  • Trend
  • Overall
  •  Main Flow
  • Federation
  • SharePoint Search Provider
  • People Search Provider
  • Index Engine

A)Trend (Query Latency Trend):
For a specified time interval, shows the query latency (in milliseconds) by percentile. For example, five percent of all queries had lower latency than the latency indicated by the fifth percentile line in the graph.

The graph includes an overlay of query rate during the specified time interval, where query rate is the number of queries per minute for which the query object model (OM) returned results.

The graph also includes an overlay of the crawl rate and the partial update rate for analytics.

You can filter this report by:

  • Start date/time
  • End date/time
  • Client type
  • Result page (search results page), which only shows if verbose logging is enabled.

By default, the graph displays data for all result pages in the Search service application.

B)Overall (Overall Query Latency):

For a specified time interval, shows the query rate (number of queries per minute) with an overlay of query latency in milliseconds.

Shows the query latency in each of the following areas:

  • Object model. This is the time it takes to communicate between the web server and the back-end.
  • This is the time it takes to transform the query, perform index look up, process results (such as removing duplicates), and return results to the object model.

You can filter this report by:

  • Start date/time
  • End date/time
  • Client Type
  • Result page (search results page), which only shows if verbose logging is enabled.

By default, the graph shows data for all result pages in the Search service application.

C)Main Flow (Default SharePoint Flow Query Latency):

For a specified time interval, shows the query latency (in milliseconds) in the main flow for query and result processing. This indicates how fast the system processes a query and returns results to the web server. The graph shows the query latency for:

  • Query rule condition matching
  • Query transformation
  • Query routing
  • Result mixing
  • Layout selection
  • Query logging
  • Other

The graph includes an overlay of query rate during the specified time interval.

You can filter this report by:

  • Start date/time
  • End date/time
  • Client Type

D)Federation (Federation Query Latency):

For a specified time interval, shows the query latency in milliseconds for all result source types.

By default, the graph shows data for all result pages in the Search service application.

You can filter this report by:

  • Start date/time
  • End date/time
  • Client type
  • Result page (search results page), which only shows if verbose logging is enabled.
  • Source type (result source type):
  • Best Bet Provider
  • Exchange Search Provider
  • Local People Provider
  • Local SharePoint Provider
  • OpenSearch Provider
  • Personal Favorites Provider
  • Remote People Provider

E)SharePoint Search Provider (Local SharePoint Search Flow Query Latency):

For a specified time interval, shows the query latency (in milliseconds) for all queries that are processed by the local SharePoint search provider. The graph shows the query latency for:

  • Keyword parsing
  • Linguistics
  • Recommendations Security Trimming
  • Security token construction
  • Index lookup
  • Result type processing
  • Custom security trimming
  • Summary generation
  • Other

The graph includes an overlay of query rate during the specified time interval.

You can filter this report by:

  • Start date/time
  • End date/time
  • Client type

 F)People Search Provider (People Search Flow Query Latency):

For a specified time interval, shows the query latency (in milliseconds) for all queries that are processed by the local people search provider. The graph shows the query latency in each of the following areas:

  • Keyword parsing
  • Linguistics
  • People pre-processing
  • Security token construction
  • Index lookup
  • Result type processing
  • Custom security trimming
  • Summary generation
  • Other

The graph includes an overlay of query rate during the specified time interval.

You can filter this report by:

  • Start date/time
  • End date/time
  • Client type

G)Index Engine (Index Engine Query Latency:

For a specified time interval, shows the query latency in milliseconds for each index server that you filter on. By default, the graph shows data for all result pages in the Search service application. You can filter this report by:

  • Start date/time
  • End date/time
  • Index server (a computer that hosts at least one index partition)
  • Result page (search results page), which only shows if verbose logging is enabled.

The graph includes an overlay of the index lookup time for the specified time interval in the past. Index lookup time is the average amount of time during a given minute that it took the index engine to return results. The index lookup time applies only to queries for which the index engine returned results.

13. Once you’re done with the “Query Health Reports “, now it’s time to take a look at the “Usage reports “in the diagnostics section. Similarly as the other reports, you can also filter these reports based on different criteria’s.

Note: The “Query Health” Reports can also be useful if you want to do some analysis on how your users are using search? What do they search for? What is the mostly searched content? etc. …This report can also be useful for you to enhance search as per your user’s search queries. Also if your users yell at you saying, “Search is really awful, I’m not able to find what exactly I need “…Then in those scenarios you probably need to do some tweaking with the Query Health reports.  You can also consider implementing “Query Rules” if necessary based on the reports.

A) Number of Queries:

This report shows the number of search queries performed. Use this report to identify search query volume trends and to determine times of high and low search activity.

B) Top Queries by Day:

This report shows the most popular search queries. Use this report to understand what types of information visitors are seeking.

C) Top Queries by Month:

This report shows the most popular search queries. Use this report to understand what types of information visitors are seeking.

D) Abandoned Queries by Day:

This report shows popular search queries that received low click-through. Use this report to identify search queries that might create user dissatisfaction and to improve the discoverability of content. Then, consider using query rules to improve the query’s results.

E) Abandoned Queries by Month:

This report shows popular search queries that received low click-through. Use this report to identify search queries that might create user dissatisfaction and to improve the discoverability of content. Then, consider using query rules to improve the query’s results.

F) No Result Queries by Day:

This report shows popular search queries that returned no results. Use this report to identify search queries that might create user dissatisfaction and to improve the discoverability of content. Then, consider using query rules to improve the query’s results.

G) No Result Queries by Month:

This report shows popular search queries that returned no results. Use this report to identify search queries that might create user dissatisfaction and to improve the discoverability of content. Then, consider using query rules to improve the query’s results.

H)Query Rule Usage by Day:

This report shows how often query rules trigger, how many dictionary terms they use, and how often users click their promoted results. Use this report to see how useful your query rules and promoted results are to users.

I)Query Rule Usage by Month:

This report shows how often query rules trigger, how many dictionary terms they use, and how often users click their promoted results. Use this report to see how useful your query rules and promoted results are to users.

14. Finally as a best practice it would also make sense to take a look at the search content sources and ensure that the crawls are running fine (This step goes without saying and I guess you would be doing this in the initial phase of troubleshooting/monitoring SharePoint search).

6

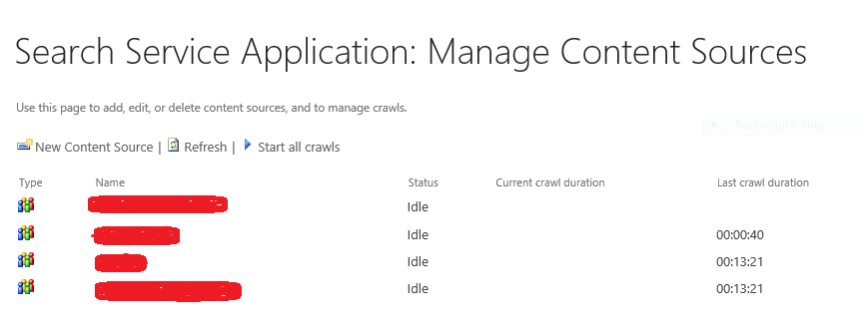
15. Ensure that all the crawls are running fine and make sure the time difference between the previous and the next crawl is running on equal time intervals .If you see some abnormal time difference between the previous and the next consecutive crawl then obviously something is wrong and it would be really worthwhile to take a look at the crawl logs.

Thanks for reading this post .Happy SharePointing!!!

Advertisement

SharePoint Online limits across different Office 365 plans:

SharePointOnline2L-1

Found this good article on Tech Target Network about SharePoint Online limitations and wanted to share it with you guys ….

Depending on the Office 365 plan your business uses, there are several SharePoint Online limits to keep in mind when planning a SharePoint migration.

As with most software as a service deployments, Microsoft imposes limits on the SharePoint Online service across its various Office 365 plans. Organizations with the appropriate service plan can typically work within those limitations, but it’s important for IT planners to recognize restrictions in advance and ensure that any migration from a local SharePoint deployment to SharePoint Online will remain within the established limits. Otherwise, the online migration may experience problems or incur unexpected premium costs for additional resources.

SharePoint Online limits typically involve storage and maximums in the number of items, users, subsites and file sizes. Consider SharePoint Online in Office 365 Business Premium, which offers base storage of 10 GB per tenant plus up to 500 MB per subscribed user; additional storage can be purchased for a fee. For example, a business with 5,000 users would see a storage limit of about 2.5 TB. This might sound like a lot, but storage-intensive file collections across many users can easily consume a significant portion of that capacity. Other factors like Recycle Bin storage can also count against storage limits.

The Office 365 Business Premium plan imposes other limits such as up to 1 TB per site collection or group document library, synchronizing up to 5,000 items — such as folders and files — in site libraries, synchronizing up to 20,000 items in the OneDrive for Business library, and handling up to 500,000 site collections where each site collection can support up to 2,000 subsites. Users can upload files as large as 2 GB per file, but can only attach files up to 250 MB.

There are also SharePoint Online limits on site elements such as lists and libraries, pages and security. For example, a single wiki or webpage can only contain up to 25 Web parts, and a single user can belong to up to 5,000 security groups. Such limits may require changes to existing local SharePoint resources before migration.

The limits for other plans such as SharePoint Online in Office 365 Enterprise, Education and Government may differ from the Business Essentials or Business Premium plans. It’s always important to check the needs of your SharePoint deployment against the preferred plan to ensure that you’re getting the most appropriate and cost-effective service. It’s also worth checking the site elements to see which, if any, sites or wikis may require changes.

SharePoint 2016 IT Pro certifications:

Sharepoint2016-670x380-670x380


Microsoft has announced the IT Pro certifications for SharePoint 2016 and they are expected to be  out by July this year . Take a look at this link below to know more about these certifications .


https://www.microsoft.com/en-sg/learning/course.aspx?cid=20339-1

https://www.microsoft.com/en-sg/learning/course.aspx?cid=20339-2

Useful SQL Queries for SharePoint Practitioners:

The SQL queries listed below can be very useful for SharePoint Farm administrators to manage/administer the SharePoint content databases .

Note: The queries mentioned below are not specific only to SharePoint databases and can be used with any SQL database.

1.To get the total number of space utilized by all the SharePoint databases in SQL server:

SELECT CONVERT(DECIMAL(10,2),(SUM(size * 8.00) / 1024.00 / 1024.00)) As UsedSpace
FROM master.sys.master_files

2.To get the name of all the SharePoint databases in a SQL instance :

Select * from Sys.Databases

3.To get the total number of space utilized by all the SharePoint databases in SQL server:

SELECT CONVERT(DECIMAL(10,2),(SUM(size * 8.00) / 1024.00 / 1024.00)) As UsedSpace

FROM master.sys.master_files

4.To find the space used by a SharePoint DB and its free size :

*Replace MY_DB with the concerned database name

use “MY_DB”
exec sp_spaceused

5.To find the size consumed by SharePoint Databases individually in SQL Server:

SELECT DB_NAME(database_id) AS DatabaseName,


Name AS Logical_Name,


Physical_Name, (size*8)/1024 SizeMB


FROM sys.master_files

6.To get the total number of SharePoint databases in the SQL server:

select  * from sys.databases

or

select  COUNT(*) from sys.databases

7.To find the path for SQL Server error logs:

sp_readerrorlog

8.To get the total number of site collections in a Web application :

select  count(*) as ‘Total Site Collection’ from sites

Note: Point to the content database hosting that site collection and run this query

9.To get the total number of sites in a web application :

select count(*) from Webs

Note: Point to the content database hosting that site collection and run this query

10.To get the Site Title and Site ID :

select Title as ‘Site title’,FullUrl, SiteId as ‘Site Collection Id’ from Webs order by SiteId

11.To get the number of sites under each site collection in a web application :

select SiteId, count(*) as ‘Total Sub Sites’ from Webs inner join Sites on Sites.Id = Webs.SiteId group by SiteId

Note: Point to the content database hosting that site collection and run this query


Useful tools for SharePoint Practitioners:

This post brings you a list of useful tools which every SharePoint Practitioner should make use of to make his day to day life easier. I personally don’t know any of the developers who developed these tools so I’m not trying to do some marketing stuff for these tools. I just wanted to share the list with you guys so that you could get benefited out of it.

Note: There are hundreds of paid/free third party tools out there to administer/manage SharePoint and I have not really tried a lot of them .The list which I’ve put together below is something which I’ve been using for quite some time now and just wanted to let you guys know that these tools have been vetted carefully during usage and they are not potentially harmful by any means, plus they are free of cost too and most of them are from code plex.


  1. ULS Viewer

A windows application for viewing SharePoint ULS log files more easily. Supports filtering and easy viewing of data.

Download Link: _ https://ulsviewer.codeplex.com/


  1. SharePoint Manager

The SharePoint Manager 2013 is a SharePoint object model explorer. It enables you to browse every site on the local farm and view every property. Please be mindful that you should have this tool running on a machine which has SharePoint installed on it.

Download Link: _ https://spm.codeplex.com/


  1. Fiddler

The Fiddler tool helps you debug web applications by capturing network traffic between the Internet and test computers. The tool enables you to inspect incoming and outgoing data to monitor and modify requests and responses before the browser receives them. Fiddler also includes a powerful event-based scripting subsystem, which you can extend by using any .NET Framework language.

Download Link: _ http://www.telerik.com/fiddler

  1. Network Monitor

Network Monitor tool can be used for capturing network traffic and protocol analysis.

Download Link: _ https://www.microsoft.com/en-in/download/details.aspx?id=4865


  1. WinDirStat

WinDirStat is a disk usage statistics viewer and cleanup tool for various versions of Microsoft Windows.

Download Link: _ https://windirstat.info/index.html


  1. SharePoint Log Viewer

SharePoint Log Viewer is a Windows application for reading and filtering Microsoft SharePoint ULS Logs.

Key Features:

  • View multiple SharePoint log files at once
  • Search by any field
  • Filter the log by any field
  • File drag & drop support
  • Live monitoring for entire farm
  • Export filtered log entries
  • Bookmark log entries
  • Get popup notification of SharePoint log events from system tray
  • Receive email notifications on errors
  • Redirect log entries to event log
  • Supports SharePoint 2007, 2010 and 2013


Download Link: _ https://sharepointlogviewer.codeplex.com/


  1. SharePoint Feature Administration and Clean Up Tool :

Feature Administration is a tool for SharePoint administrators and developers to manage SP features. It finds and cleans faulty Feature Definitions and orphaned reminders.

The Feature Admin Tool finds faulty Feature Definitions and cleanly uninstalls them.
It finds feature remainders in sites, Site Collections, WebApps and in the Farm, caused e.g. by forcefully uninstalled Features from a farm without deactivating them before. These faulty features, never visible, cause errors.

Download Link: _ https://featureadmin.codeplex.com/


  1. SharePoint Command Builder :

As the name implies, you can use this tool to build SharePoint PowerShell commands that can simplify your daily work.

Link: _ https://www.microsoft.com/resources/TechNet/en-us/Office/media/WindowsPowerShell/WindowsPowerShellCommandBuilder.HTML

  1. SharePoint Manager 2013 Online :

If you’re using SharePoint Online, then this tool could be your best friend. SharePoint Manager 2013 Online, provides the user a quick and easy overview of the structure and data hidden behind the scenes. Unlike the server version on codeplex, this app only uses html and JavaScript leveraging the SharePoint REST API. The well-known navigation tree on the left side and a property panel on the right side deliver an extremely user-friendly interface, which allows the user to burrow into SharePoint Online structure and hidden gems.

Download Link: _ https://store.office.com/sharepoint-manager-2013-online-WA104025157.aspx?assetid=WA104025157


  1. SharePoint 2013 Search Query Tool:

After running the query, you can view all types of result sets returned; Primary Results, Refinement Results, Query Rules Results, Query Suggestions, in addition to the actual raw response received from the Search service.

This can be used both with SharePoint 2013 on-premises and SharePoint Online. I also explained in detail the usage of this tool in a previous blog post. Click here to read that.

Download Link: _ http://sp2013searchtool.codeplex.com/


  1. SharePoint Host name site collection creator :

The SharePoint Host named Site Collection (HNSC) Creator SharePoint Admins to create HNSC via a GUI instead of PowerShell. This can be used by two ways. One of them is a Windows Forms application that needs no installation, and the second one is a SharePoint 2013 farm solution that plugs in the Central Admin for a native SharePoint experience

Download Link: _ https://hnsc.codeplex.com/


  1. SharePoint Designer :

Microsoft SharePoint Designer (SPD), formerly known as Microsoft Office SharePoint Designer, is a discontinued HTML editor freeware specialized in creating or modifying Microsoft SharePoint sites, workflows and web pages. It is a part of Microsoft SharePoint family of products.

Please note that Microsoft has announced that SharePoint 2016 will not have SP Designer 2016 .That has been discontinued in the 2016 version.

Download link: _ https://www.microsoft.com/en-in/download/details.aspx?id=35491

13. Advanced REST Client plugin for Google Chrome:

SharePoint Developers would probably know the power of this tool . There’s an awesome plugin for Chrome called Advanced REST Client which allows you to investigate the REST calls and configure your queries pretty simply through the UI. You get to see the results and the request times directly in the browser and you can play with the parameters etc easily

Download link :_https://github.com/jarrodek/ChromeRestClient

14.  SharePoint Client Browser for SharePoint Online and SharePoint on premises:

Remote SharePoint development is getting more important. Especially with SharePoint Apps. To speed up development, find hidden lists/items/documents, discover the structure or specific artifact properties use the SharePoint Client Browser which supports SharePoint 2010, SharePoint 2013 and SharePoint Online (Office 365)

Uses of this tool?

  • Get insight in your site collection structure
  • Find hidden lists, items or documents
  • Discover artifact properties
  • Easily start PowerShell, via context menu, and run (scripted) queries against your remote site collection
  • Support for both SharePoint 2010 and SharePoint 2013
  • Connect to on-premise or SharePoint Online (Office 365) site collections
  • No installer
  • Remote access from your desktop to site collection via Client Side Object Model (CSOM)
  • Can run remote, no need to run on the SharePoint server itself

Download link : _ https://spcb.codeplex.com


Demystifying the SharePoint My site “Social List”

So this post is regarding the “Social List” which you might have noticed in your SharePoint My site. I’m purposely using the term “might have *” because not everyone would have payed attention to that list in the SharePoint My site. That being said, the purpose of this post is to make you understand what’s the “Social list “in your SharePoint My site and how it works.

Let’s begin with where I find it ….

Go to your SharePoint My site –>Site contents –>Take a look at the items there. You should be able to find the “Social List “as shown in the image below.

1

What’s a social list?

It’s a default list that’s present in your SharePoint “My site” that displays all the content you’re following.

The url for this will look like: _ https://mysite.sharepoint.com/personal/vignesh/Social/FollowedContent.aspx

At times you might see some weird issues while opening your SharePoint My site and the error will say something about the follow feature/social feature not working … Remember in scenarios like that , the culprit could be the “ Social List “ . For some reason if this list gets corrupted, then you might face issues while opening your SharePoint “My site “.

Feature that activates this list:

A hidden feature named “Social Data Storage “in your SharePoint My site takes care of turning on this list. Hence if this feature is deactivated then you won’t be able to find this list in your SharePoint “My site” and would end up facing problems while accessing the my site. I’ll discuss in detail about this feature later on this post.

What’s present inside the “Social list”?

Well , if you need to take a look at what’s present inside this list , please use “ SharePoint Designer “ and try to open it .

This is what you would find inside the “Social list” ….

2

3

Social Data storage feature:

As mentioned earlier, the Social data storage feature takes care of turning on this list. The GUID of this feature is “FA8379C9-791A-4FB0-812E-D0CFCAC809C8”.

While troubleshooting “My site” or “following” issues, please make sure that this feature is activated on your My site.

Since this is a hidden feature, you need to use a tool called “SharePoint Manager ” from Codeplex or PowerShell to check if this feature is activated in your My site.

Using SharePoint Manager:

  1. Install this in a machine which has SharePoint on it and expand the Mysite web app .
  2. Expand the sites option
  3. Search for the problematic user’s Mysite
  4. Expand the list of features
  5. Look for a green plus symbol next to the feature

Check the screenshot below ….

4

5

Using PowerShell command:

Get-SPFeature -Site https://mysite.sharepoint.com/personal/username  | Sort DisplayName | FT DisplayName,Id

6

Things to know:

  1. There are certain features that gets activated in a user’s My site only when a user tries to visit his My site for the first time, during this process  SharePoint will trigger the “My site  instantiation process” which will create the user’s My site . In addition to that there are few other features in your  My site which doesn’t get activated until you start using it (Ex: Your My site Blog). The feature related to the My site blog won’t be activated in your My site until you start using the Blog in your My site.


  1. A user cannot follow a site, a person, a tag or a document without having a My site set up for him first. If you try to do, SharePoint will throw an error stating that you don’t have a My site yet and will prompt you to create one.